James Connolly
Back

2024 to 2025

DataPulse

June 2025

Co-author, DataPulse paper at DATA 2025

14th International Conference on Data Science, Technology and Applications, Bilbao, Spain

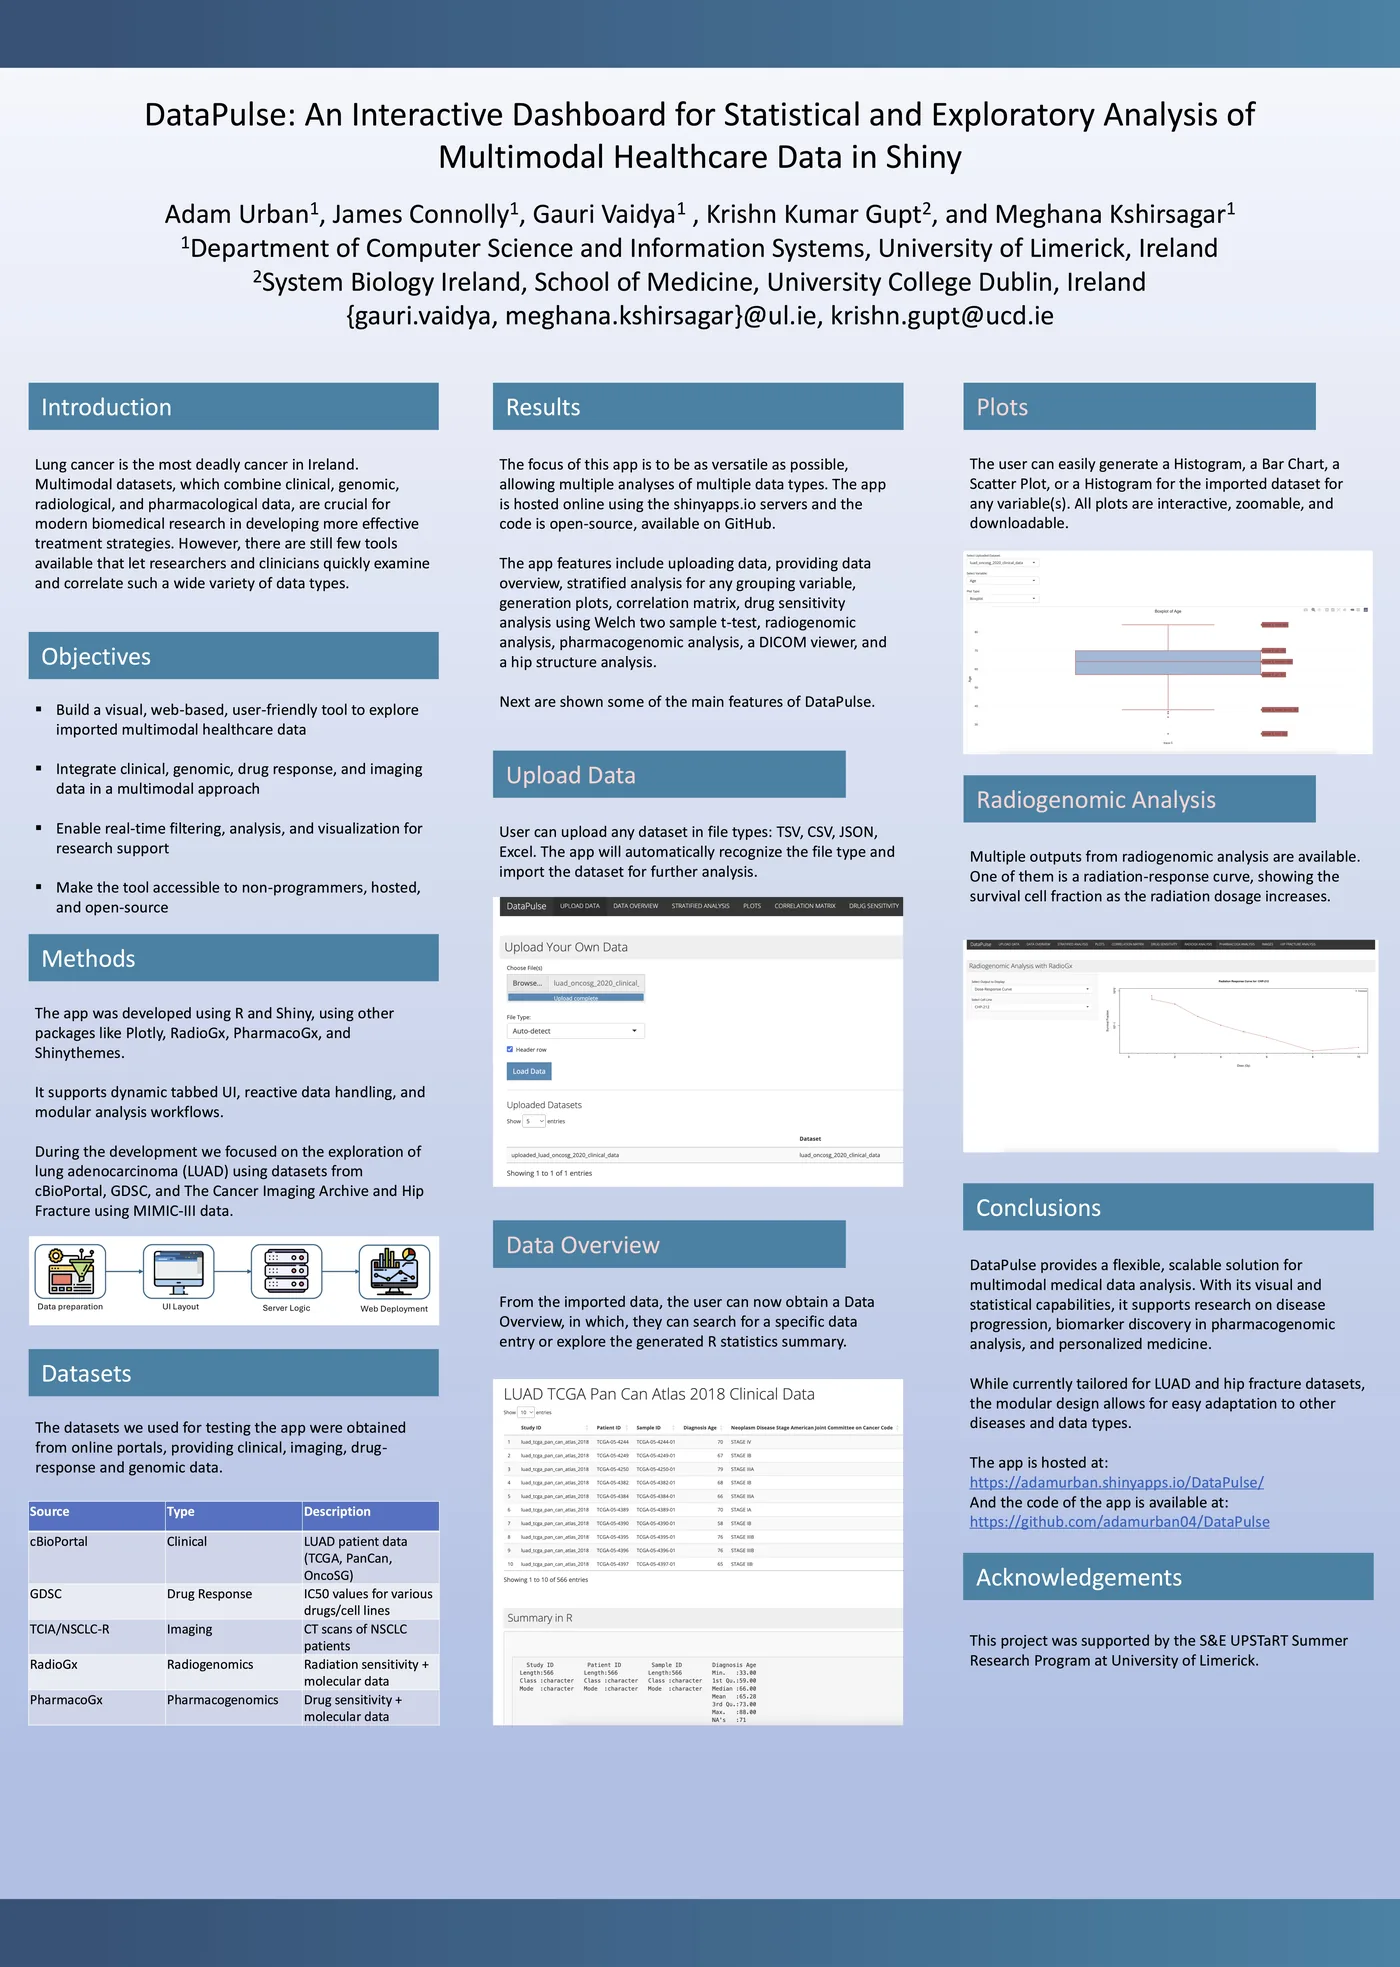
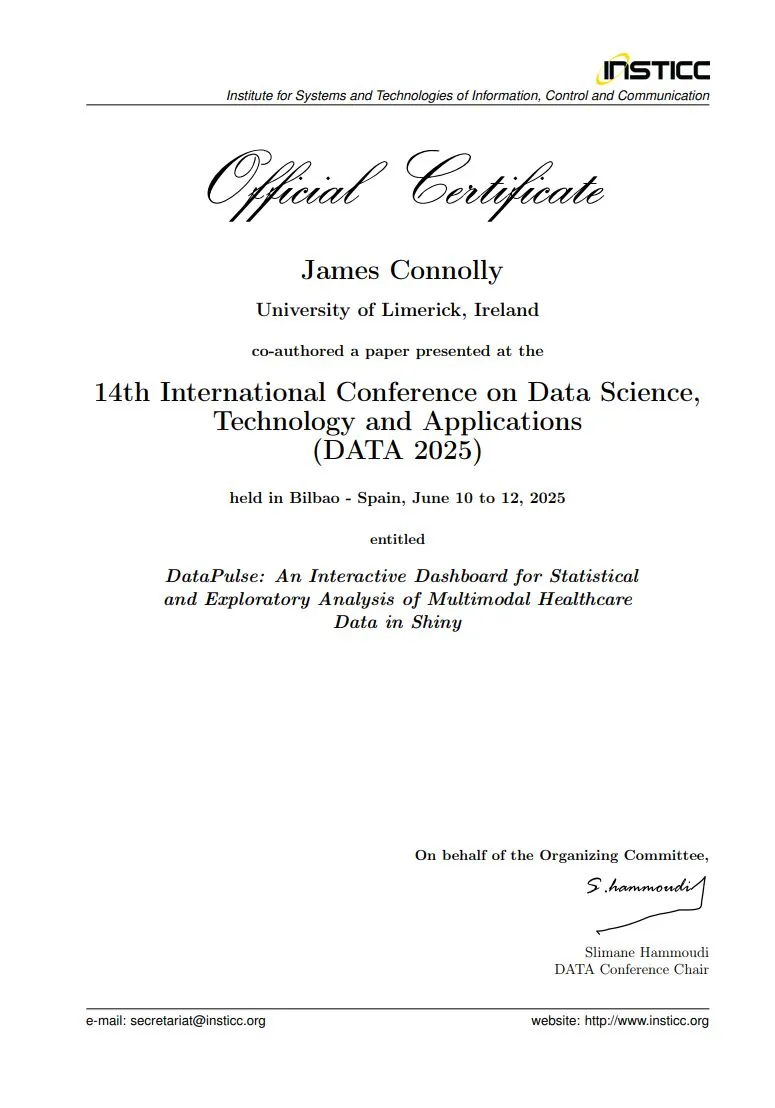
The research internship became a co-authored, peer-reviewed conference paper, DataPulse: An Interactive Dashboard for Statistical and Exploratory Analysis of Multimodal Healthcare Data in Shiny, presented at DATA 2025.

Paper details

DATA 2025 certificate for co-authoring the DataPulse paper
DATA 2025 certificate

Summer 2024

Research intern, University of Limerick

Biocomputing and Development Systems Group

In summer 2024 I took part in UL's UPSTaRT programme (the S&E Undergraduate Programme of Summer Training and Research Track) with my classmate Adam Urban, supervised by Prof. Conor Ryan and Dr. Meghana Kshirsagar. Our project was Discovering Novel Biomarkers for Pan Cancers, and what we built became DataPulse.

I researched and built a responsive, data-driven application in R and Shiny for visualising and analysing complex biological and medical datasets. To keep it fast, I engineered a predictive pre-loading data architecture that cut view load times by 38%.

Working in a multidisciplinary team, I did data exploration, debugging and statistical modelling, and gave weekly technical research presentations to senior researchers.

38% faster view loads

Live appCode
DataPulse research poster: an interactive dashboard for statistical and exploratory analysis of multimodal healthcare data in Shiny
DataPulse research poster

Why we built it

Finding bias in healthcare data

Bias in a dataset can quietly undermine how accurate and generalisable cancer research is. We wanted a tool that gives summary statistics and surfaces data bias across clinical tables, genomic data and medical imaging such as CT, MRI and fMRI.

Every week we met our mentor and the other interns to review progress, get feedback and plan next steps, and on Mondays we joined the lab meeting of the Biocomputing and Development Systems (BDS) group.

The summer, week by week

27 May to 10 June

Weeks 1 and 2: Getting started

We started by learning R, RStudio and Shiny, through Codecademy's Learn R course, YouTube tutorials and Shiny's Get Started guides, and read the key papers our advisors gave us for the biological background.

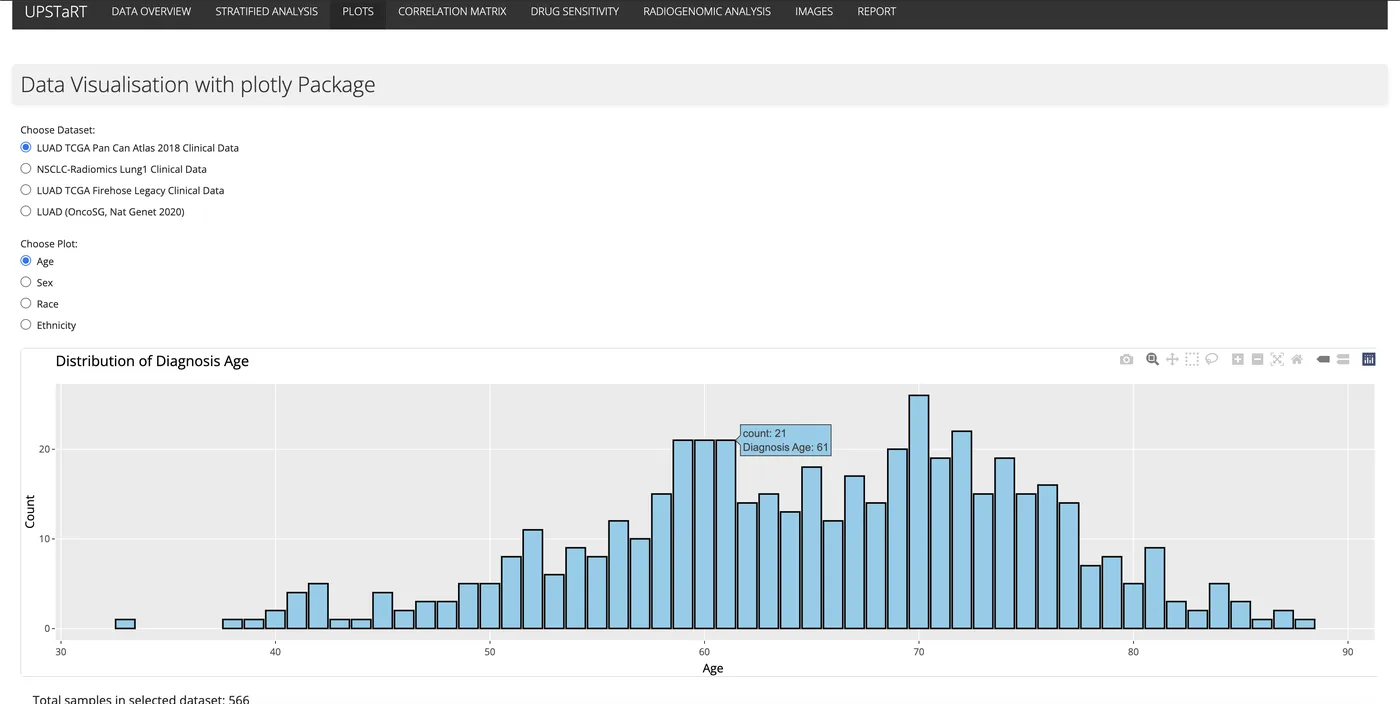
By the second week we had a first version of the app visualising a lung adenocarcinoma clinical dataset from cBioPortal, hosted on shinyapps.io.

The Plots tab: diagnosis age across a lung adenocarcinoma clinical dataset

10 to 24 June

Weeks 3 and 4: More data and a DICOM viewer

We added more clinical datasets for the user to choose between, and worked in feedback from a progress presentation to our advisors.

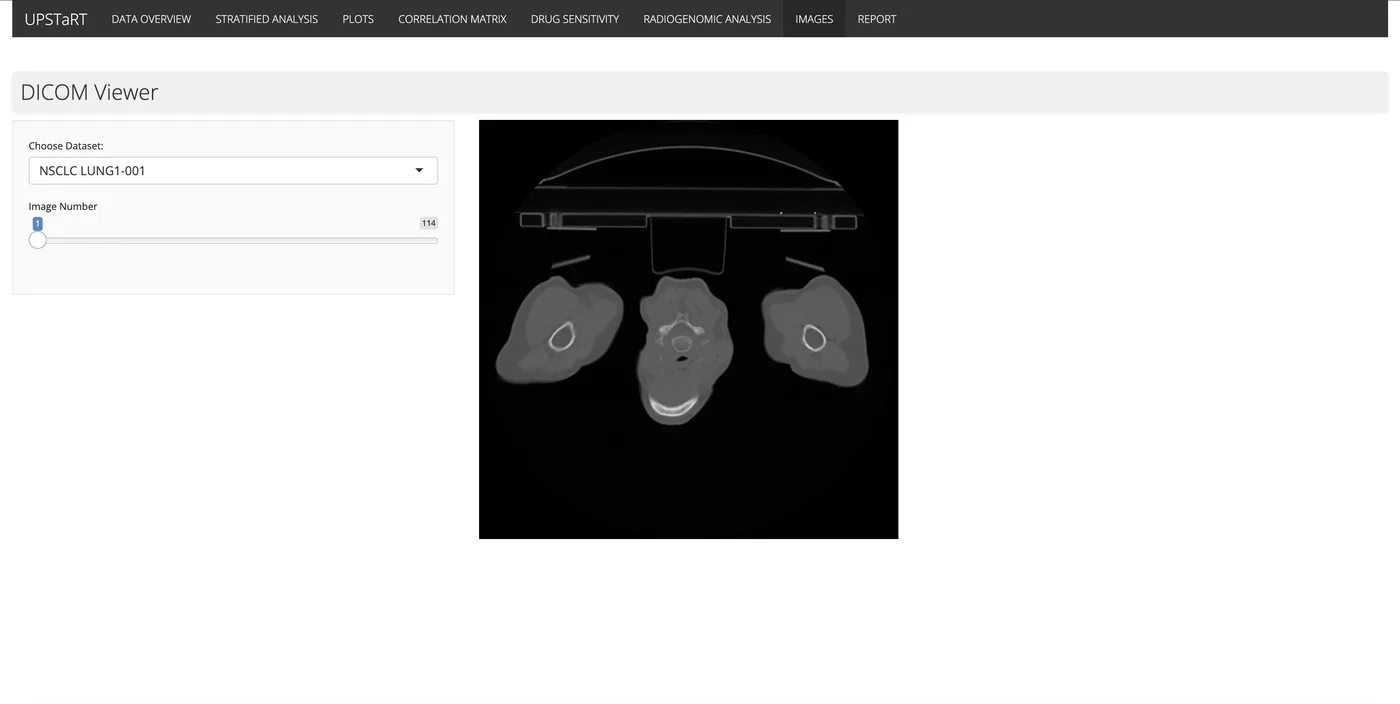
We wrote an R Markdown notebook documenting the analysis so it could be reproduced, and brought in the NSCLC Radiomics dataset of non-small cell lung cancer CT scans, viewable in the app through a DICOM viewer.

The DICOM viewer, browsing CT scans from the NSCLC Radiomics dataset

24 June to 7 July

Weeks 5 and 6: Interactivity and statistics

We made the plots interactive with Plotly and added a correlation matrix for the numeric clinical variables.

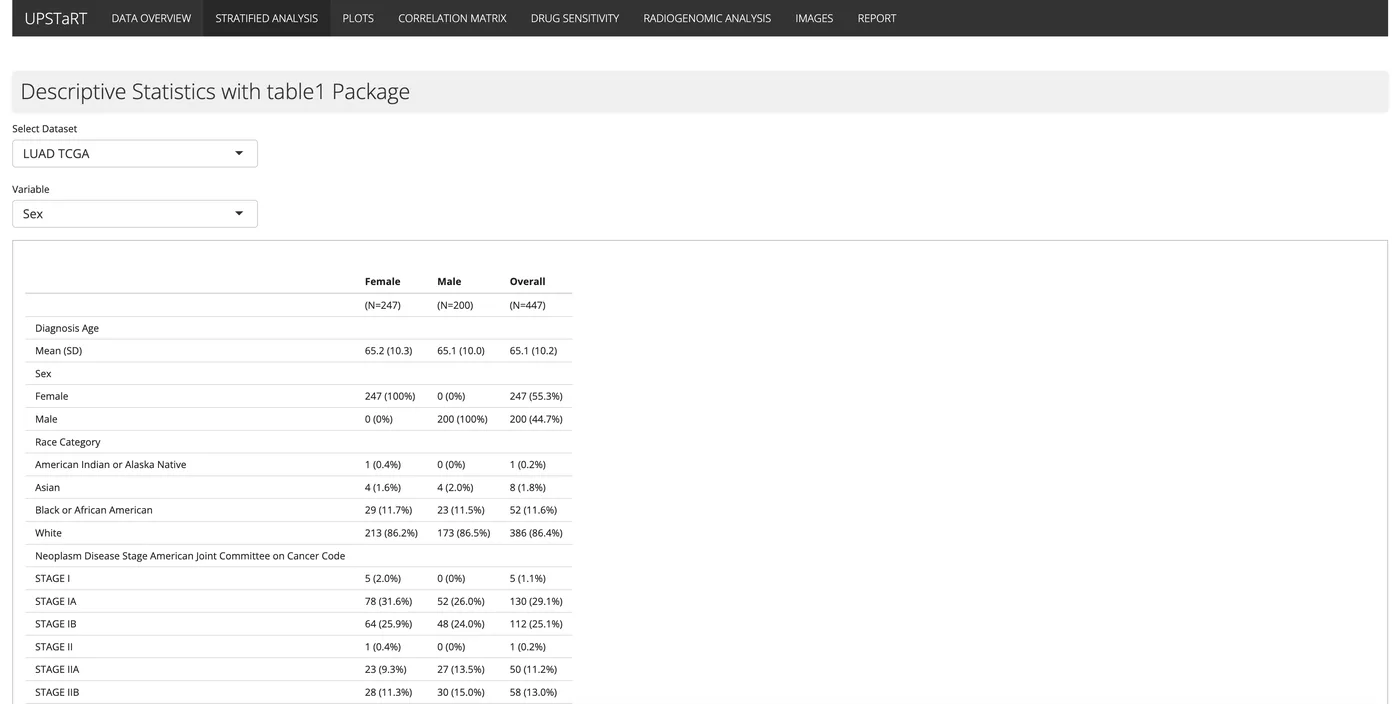
We presented the work as a data bias visualisation tool to the Culhane Lab in the School of Medicine. Following their feedback, we added stratified analysis with the table1 R package, split by whichever categorical variable the user picks.

Stratified analysis with the table1 package

7 to 21 July

Weeks 7 and 8: T-tests and radiogenomics

We started working with RadioGx and PharmacoGx, two Bioconductor packages from BHKLab, for radiogenomic and pharmacogenomic analysis.

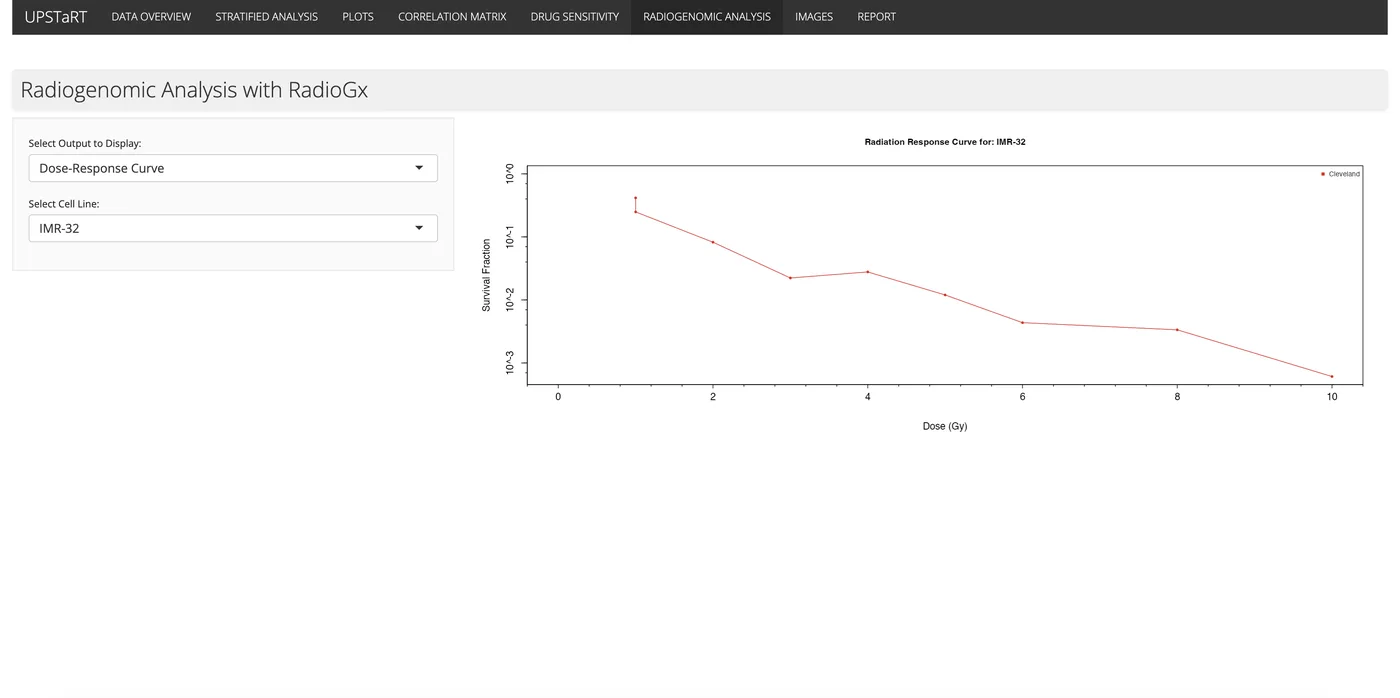
We added a t-test comparing drug sensitivity across drugs, cell lines or tissue types, and used RadioGx to look at how cell lines respond to radiation and which genes are linked to that response. That matters for biomarker discovery, combination therapy and personalised medicine.

A radiation dose-response curve from RadioGx

Late July to August

Weeks 9 and 10: Pharmacogenomics and the report

With PharmacoGx we plotted drug-response curves for a chosen drug and cell line, and built drug sensitivity signatures for identifying biomarkers.

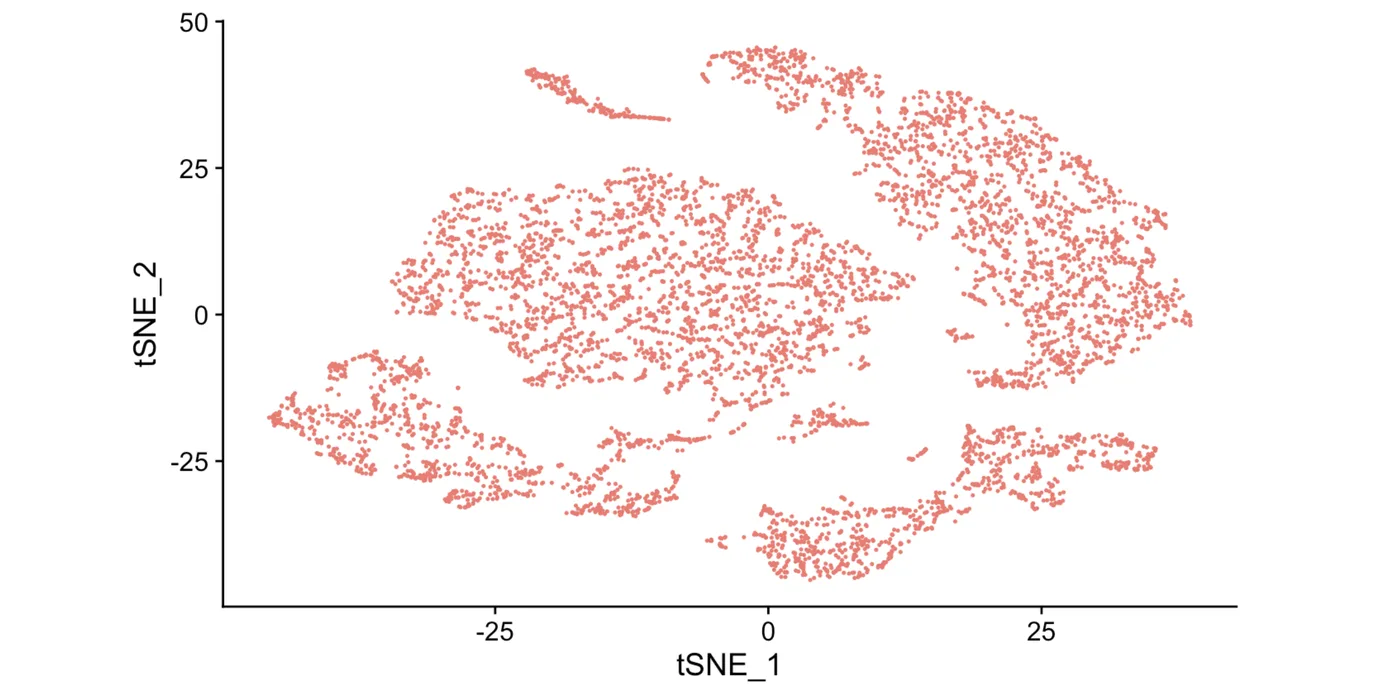
We also worked through a single-cell RNA-seq analysis in Seurat: importing the raw expression matrix, quality control, picking out highly variable genes, PCA, then t-SNE and UMAP to find clusters. The last week went into finishing the report, documentation and code.

t-SNE clusters from the Seurat single-cell analysis

The result

DataPulse

DataPulse brings all of it together for finding data bias and getting summary statistics: interactive clinical plots, demographics (age, gender, survival status, race and ethnicity), the DICOM CT viewer, a correlation matrix, stratified analysis, t-tests on IC50 drug response data, and radiogenomic and pharmacogenomic analysis.

It focuses on lung adenocarcinoma, but it's built to be useful for pan-cancer research. The summer taught me a lot about data analysis, building tools, and doing research as part of a team.

DataPulse appDataPulse codeAdam's write-up

Get in touch